

 EV Zone
October 2026 · Published 18 November 2026
Brumble Cost of Motoring Index: October 2026
How much more or less does it cost to run a car than a year ago? Each month we price the same petrol car, driven the same 7,100 miles a year, using official ONS prices. That is the average for all cars in England (DfT National Travel Survey, NTS0901, 2025).
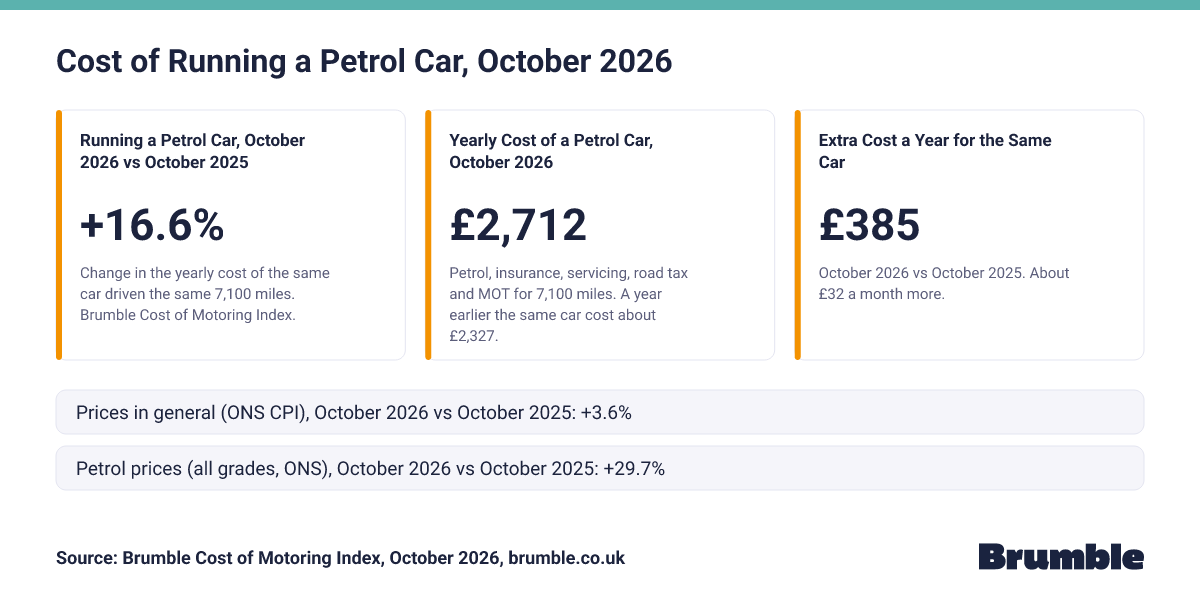
Running a petrol car cost about 16.6% more in October 2026 than a year earlier, our index suggests. That is about £385 a year more for the same car. Prices in general rose 3.6% (ONS CPI).
This is a higher yearly rise than any month since September 2022, when it was 17.4%. These are running costs only. They do not include buying the car, finance or parking.
Key Figures
In October 2026, it cost about £2,712 a year to run a petrol car, against about £2,327 a year earlier. That is about £385 more, or about £32 a month, a rise of 16.6% year on year. The cost covers petrol, insurance, servicing and repairs, road tax and the MOT for a car driven 7,100 miles a year.
Running a Petrol Car, October 2026 vs October 2025
+16.6%
Change in the yearly cost of the same car driven the same 7,100 miles. Brumble Cost of Motoring Index.
Yearly Cost of a Petrol Car, October 2026
£2,712
Petrol, insurance, servicing, road tax and MOT for 7,100 miles. A year earlier the same car cost about £2,327.
Extra Cost a Year for the Same Car
£385
October 2026 vs October 2025. About £32 a month more.
Prices in general (ONS CPI), October 2026 vs October 2025: +3.6%
Petrol prices (all grades, ONS), October 2026 vs October 2025: +29.7%
Embed This Chart
Copy this code to add the chart to your website. Please keep the source link.
<iframe src="https://brumble.co.uk/data/cost-of-motoring-index/2026-10/embed/key-figures" title="Cost of Running a Petrol Car: Key Figures, Brumble Cost of Motoring Index 2026-10" width="100%" height="560" style="border:0;" loading="lazy"></iframe>
<p>Source: <a href="https://brumble.co.uk/data/cost-of-motoring-index">Brumble Cost of Motoring Index</a></p>Want to Work Out Your Own Costs?
Our figures are for a petrol car. Your own costs depend on your car, where you live and how far you drive. Our guide has a calculator you can use.
Work out what your car costs to runThe Basket We Use
Petrol (E10) costs about £1,391 a year, about 51% of the £2,712 total. Insurance is £566, servicing and repairs £500, road tax £200 and the MOT £54.85. We price Petrol (E10) at 172.40p a litre, our Fuel Price Index average for 27 to 31 October 2026.
A petrol car driven 7,100 miles a year. That is the average for all cars in England (DfT National Travel Survey, NTS0901, 2025). We assume a petrol car that does 40mpg. That uses about 806.9 litres of Petrol (E10) a year. This is the 2026 basket, set on 17 November 2026. We review it each January. The next review is in January 2027.
| Cost | October 2026 (a Year) | Where the Cost Comes From | How We Track the Price |
|---|---|---|---|
| Petrol | £1,391.15 | 806.9 litres of Petrol (E10) at 172.40p a litre. Brumble Fuel Price Index, 27 to 31 October 2026. | Petrol price index (all grades, ONS), L7FP |
| Insurance | £566.00 | ABI average premium, Q2 2026. The basket keeps this figure fixed for 2026. | ONS motor vehicle insurance index (L7JE) |
| Servicing and repairs (labour) | £402.36 | 80.5% of £500 for servicing and repairs, a Brumble allowance. Split using ONS 2026 weights. | ONS maintenance and repairs index (D7ED) |
| Servicing and repairs (parts) | £97.64 | 19.5% of £500 for servicing and repairs, a Brumble allowance. Split using ONS 2026 weights. | ONS spare parts and accessories index (D7EB) |
| Road tax | £200.00 | Standard rate for a car first registered from April 2017, from 1 April 2026 (Finance Act 2026, section 92(7)). | GOV.UK standard rate for cars first registered from April 2017 |
| MOT | £54.85 | We use £54.85, the maximum MOT fee for a car (GOV.UK, unchanged since 1 April 2010). Test centres cannot charge more than this. | GOV.UK maximum MOT fee, unchanged since 1 April 2010 |
| Total | £2,712.00 | Yearly cost of the basket at October 2026 prices. | It leaves out buying the car, finance, parking, tyres and breakdown cover. |
What Changed in the Basket
The same basket cost about £385 more than a year earlier, a rise of 16.6% year on year. Petrol added about £319 and insurance about £39. The MOT did not change.
Each cost, priced in October 2026 and a year earlier. "Moved our figure by" shows how many percentage points each cost added to, or took away from, the headline. They add up to the headline, +16.6%.
Source: Brumble Cost of Motoring Index, October 2026, from ONS, GOV.UK and Brumble Fuel Price Index data. brumble.co.uk/data
| Cost | October 2026 | October 2025 | Change | Share a Year Ago | Moved Our Figure By |
|---|---|---|---|---|---|
| Petrol | £1,391.15 | £1,072.29 | +29.7% | 46.1% | +13.7 points |
| Insurance | £566.00 | £527.30 | +7.3% | 22.7% | +1.7 points |
| Servicing and repairs (labour) | £402.36 | £382.22 | +5.3% | 16.4% | +0.9 points |
| Servicing and repairs (parts) | £97.64 | £94.95 | +2.8% | 4.1% | +0.1 points |
| Road tax | £200.00 | £195.00 | +2.6% | 8.4% | +0.2 points |
| MOT | £54.85 | £54.85 | 0.0% | 2.4% | 0.0 points |
| Total | £2,712.00 | £2,326.60 | +16.6% | 100.0% | +16.6 points |
ONS works out these yearly rates from exact figures, so they can differ by 0.1 from the changes in our running cost figure.
Download image: What changed in the cost of running a car, October 2026 (PNG)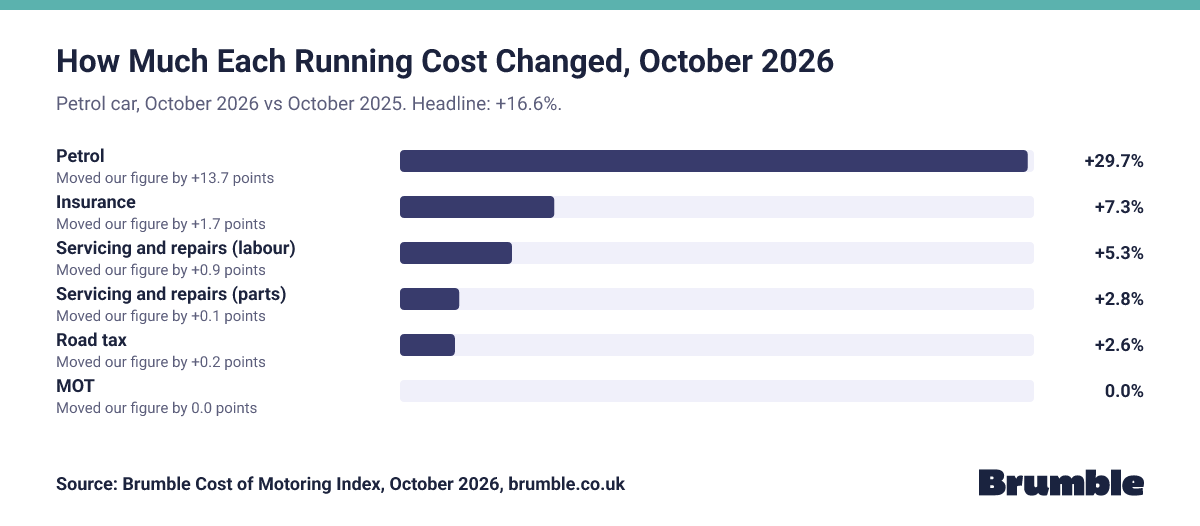
Embed This Chart
Copy this code to add the chart to your website. Please keep the source link.
<iframe src="https://brumble.co.uk/data/cost-of-motoring-index/2026-10/embed/breakdown" title="How Much Each Running Cost Changed, Brumble Cost of Motoring Index 2026-10" width="100%" height="560" style="border:0;" loading="lazy"></iframe>
<p>Source: <a href="https://brumble.co.uk/data/cost-of-motoring-index">Brumble Cost of Motoring Index</a></p>Cost of Running a Car Compared With Inflation
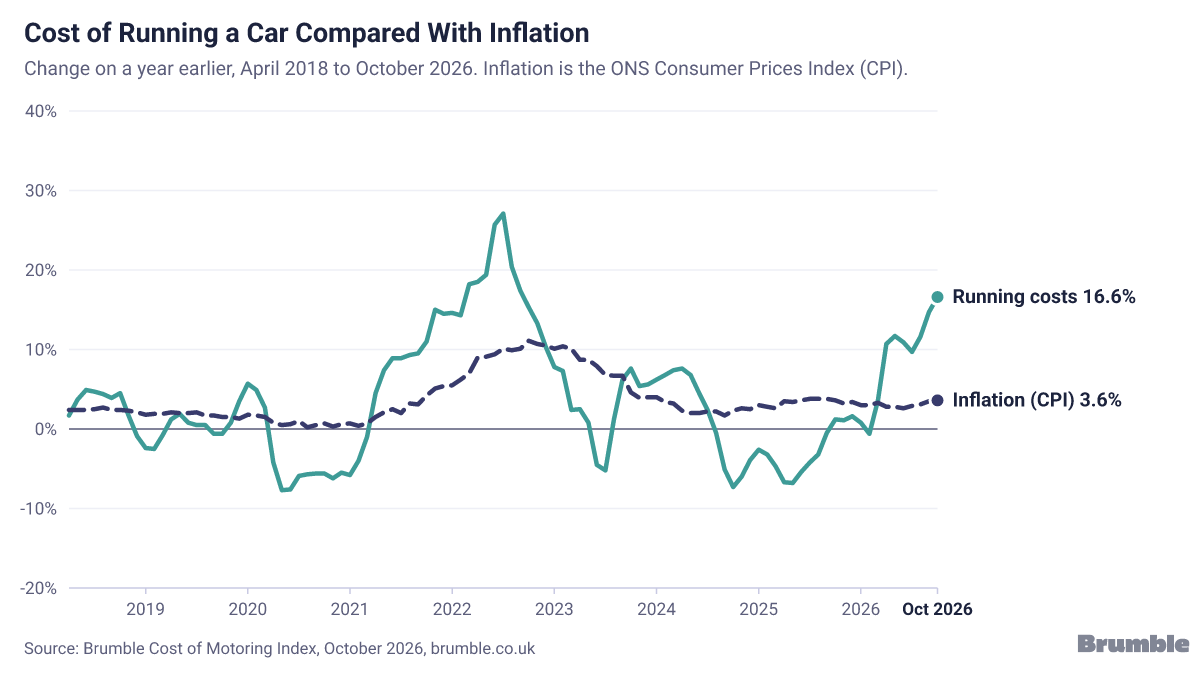
Motoring inflation is running well ahead of inflation in general. In October 2026, the cost of running a petrol car was 16.6% higher than a year earlier, while prices in general rose 3.6% (ONS CPI). Car running costs rose faster year on year than in any month since September 2022.
The change in the yearly cost of running the same petrol car each month since April 2018, next to inflation, measured by the ONS Consumer Prices Index (CPI). Both compare each month with the same month a year earlier.
| Month | Running Costs | Inflation (CPI) |
|---|---|---|
| October 2026 | +16.6% | +3.6% |
| September 2026 | +14.7% | +3.5% |
| August 2026 | +11.6% | +3.1% |
| July 2026 | +9.7% | +2.9% |
| June 2026 | +10.9% | +2.6% |
| May 2026 | +11.7% | +2.8% |
| April 2026 | +10.7% | +2.8% |
| March 2026 | +3.6% | +3.3% |
| February 2026 | -0.6% | +3.0% |
| January 2026 | +0.8% | +3.0% |
| December 2025 | +1.6% | +3.4% |
| November 2025 | +1.1% | +3.2% |
| October 2025 | +1.2% | +3.6% |
| September 2025 | -0.5% | +3.8% |
| August 2025 | -3.2% | +3.8% |
| July 2025 | -4.2% | +3.8% |
| June 2025 | -5.4% | +3.6% |
| May 2025 | -6.8% | +3.4% |
| April 2025 | -6.7% | +3.5% |
| March 2025 | -4.7% | +2.6% |
| February 2025 | -3.2% | +2.8% |
| January 2025 | -2.6% | +3.0% |
| December 2024 | -3.9% | +2.5% |
| November 2024 | -6.0% | +2.6% |
| October 2024 | -7.3% | +2.3% |
| September 2024 | -5.1% | +1.7% |
| August 2024 | -0.5% | +2.2% |
| July 2024 | +2.4% | +2.2% |
| June 2024 | +4.5% | +2.0% |
| May 2024 | +6.8% | +2.0% |
| April 2024 | +7.6% | +2.3% |
| March 2024 | +7.4% | +3.2% |
| February 2024 | +6.8% | +3.4% |
| January 2024 | +6.2% | +4.0% |
| December 2023 | +5.6% | +4.0% |
| November 2023 | +5.4% | +3.9% |
| October 2023 | +7.6% | +4.6% |
| September 2023 | +6.2% | +6.7% |
| August 2023 | +1.2% | +6.7% |
| July 2023 | -5.2% | +6.8% |
| June 2023 | -4.5% | +7.9% |
| May 2023 | +0.8% | +8.7% |
| April 2023 | +2.5% | +8.7% |
| March 2023 | +2.4% | +10.1% |
| February 2023 | +7.3% | +10.4% |
| January 2023 | +7.8% | +10.1% |
| December 2022 | +10.3% | +10.5% |
| November 2022 | +13.3% | +10.7% |
| October 2022 | +15.3% | +11.1% |
| September 2022 | +17.4% | +10.1% |
| August 2022 | +20.4% | +9.9% |
| July 2022 | +27.1% | +10.1% |
| June 2022 | +25.7% | +9.4% |
| May 2022 | +19.4% | +9.1% |
| April 2022 | +18.5% | +9.0% |
| March 2022 | +18.2% | +7.0% |
| February 2022 | +14.3% | +6.2% |
| January 2022 | +14.6% | +5.5% |
| December 2021 | +14.5% | +5.4% |
| November 2021 | +15.0% | +5.1% |
| October 2021 | +11.0% | +4.2% |
| September 2021 | +9.5% | +3.1% |
| August 2021 | +9.3% | +3.2% |
| July 2021 | +8.9% | +2.0% |
| June 2021 | +8.9% | +2.5% |
| May 2021 | +7.4% | +2.1% |
| April 2021 | +4.5% | +1.5% |
| March 2021 | -1.0% | +0.7% |
| February 2021 | -4.0% | +0.4% |
| January 2021 | -5.8% | +0.7% |
| December 2020 | -5.5% | +0.6% |
| November 2020 | -6.2% | +0.3% |
| October 2020 | -5.6% | +0.7% |
| September 2020 | -5.6% | +0.5% |
| August 2020 | -5.7% | +0.2% |
| July 2020 | -5.9% | +1.0% |
| June 2020 | -7.6% | +0.6% |
| May 2020 | -7.7% | +0.5% |
| April 2020 | -4.2% | +0.8% |
| March 2020 | +2.7% | +1.5% |
| February 2020 | +4.9% | +1.7% |
| January 2020 | +5.7% | +1.8% |
| December 2019 | +3.5% | +1.3% |
| November 2019 | +0.8% | +1.5% |
| October 2019 | -0.6% | +1.5% |
| September 2019 | -0.6% | +1.7% |
| August 2019 | +0.5% | +1.7% |
| July 2019 | +0.5% | +2.1% |
| June 2019 | +0.8% | +2.0% |
| May 2019 | +1.9% | +2.0% |
| April 2019 | +1.2% | +2.1% |
| March 2019 | -0.8% | +1.9% |
| February 2019 | -2.5% | +1.9% |
| January 2019 | -2.4% | +1.8% |
| December 2018 | -0.9% | +2.1% |
| November 2018 | +1.7% | +2.3% |
| October 2018 | +4.5% | +2.4% |
| September 2018 | +3.9% | +2.4% |
| August 2018 | +4.4% | +2.7% |
| July 2018 | +4.7% | +2.5% |
| June 2018 | +4.9% | +2.4% |
| May 2018 | +3.7% | +2.4% |
| April 2018 | +1.7% | +2.4% |
Embed This Chart
Copy this code to add the chart to your website. Please keep the source link.
<iframe src="https://brumble.co.uk/data/cost-of-motoring-index/2026-10/embed/vs-cpi" title="Cost of Running a Car Compared With Inflation, Brumble Cost of Motoring Index 2026-10" width="100%" height="560" style="border:0;" loading="lazy"></iframe>
<p>Source: <a href="https://brumble.co.uk/data/cost-of-motoring-index">Brumble Cost of Motoring Index</a></p>Motoring Prices From the ONS Since April 2018
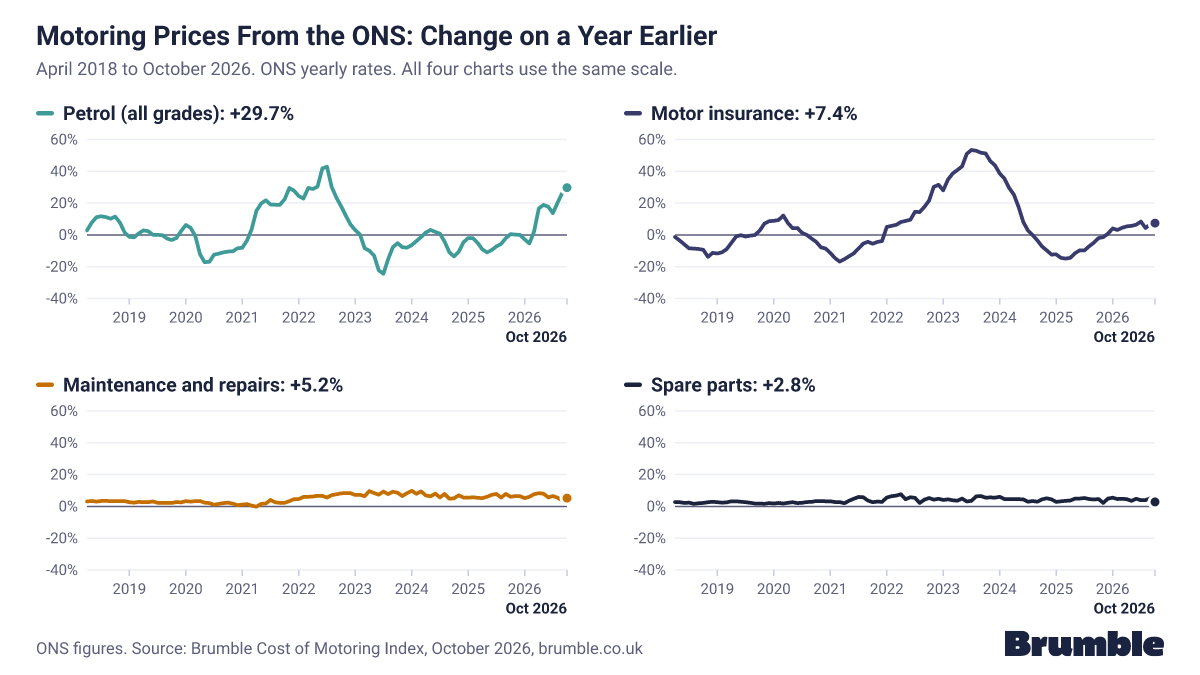
Petrol makes up most of the rise in car running costs: about £319 of the £385. ONS figures show petrol prices (all grades) up 29.7% year on year. Motor insurance rose 7.4%, maintenance and repairs 5.2% and spare parts 2.8%.
These are the ONS figures behind our basket. Each chart shows the change on a year earlier, and all four use the same scale.
- Petrol (all grades, ONS) prices rose 29.7% in the year to October 2026, higher than any month since August 2022 (30.2%). ONS figure.
- Fuels and lubricants (all grades, ONS) prices rose 33.2% in the year to October 2026, higher than any month since July 2022 (43.7%). ONS figure.
- Diesel (all grades, ONS) prices rose 39.5% in the year to October 2026, higher than any month since July 2022 (46.1%). ONS figure.
Petrol (all grades): +29.7%
ONS series L7R5
Motor insurance: +7.4%
ONS series L7U3
Maintenance and repairs: +5.2%
ONS series D7IP
Spare parts: +2.8%
ONS series D7IN
ONS figures. Source: Brumble Cost of Motoring Index, October 2026, from ONS, GOV.UK and Brumble Fuel Price Index data. brumble.co.uk/data
ONS works out these yearly rates from exact figures, so they can differ by 0.1 from the changes in our running cost figure.
| Month | Petrol (all grades, ONS) | Motor Insurance | Maintenance and Repairs | Spare Parts |
|---|---|---|---|---|
| October 2026 | +29.7% | +7.4% | +5.2% | +2.8% |
| September 2026 | +26.5% | +6.8% | +3.7% | +5.1% |
| August 2026 | +20.2% | +4.3% | +5.5% | +4.0% |
| July 2026 | +13.7% | +8.4% | +6.5% | +3.9% |
| June 2026 | +17.7% | +6.4% | +5.7% | +4.8% |
| May 2026 | +18.9% | +5.7% | +8.0% | +3.5% |
| April 2026 | +16.6% | +5.4% | +8.3% | +4.5% |
| March 2026 | +2.0% | +4.4% | +7.6% | +4.8% |
| February 2026 | -5.4% | +3.1% | +6.0% | +4.6% |
| January 2026 | -2.8% | +4.1% | +5.2% | +5.5% |
| December 2025 | 0.0% | +0.8% | +6.4% | +4.9% |
| November 2025 | +0.2% | -1.4% | +6.5% | +2.2% |
| October 2025 | +0.5% | -2.0% | +6.0% | +4.6% |
| September 2025 | -2.1% | -4.9% | +7.8% | +4.3% |
| August 2025 | -5.7% | -7.2% | +5.6% | +4.6% |
| July 2025 | -7.3% | -9.8% | +7.8% | +5.3% |
| June 2025 | -9.5% | -9.7% | +7.3% | +4.9% |
| May 2025 | -11.0% | -11.5% | +6.0% | +4.9% |
| April 2025 | -9.1% | -14.4% | +5.2% | +3.7% |
| March 2025 | -5.0% | -14.9% | +5.4% | +3.5% |
| February 2025 | -2.1% | -14.4% | +5.8% | +3.2% |
| January 2025 | -2.0% | -12.3% | +5.5% | +2.8% |
| December 2024 | -4.6% | -12.4% | +5.6% | +4.4% |
| November 2024 | -10.7% | -9.7% | +7.0% | +5.1% |
| October 2024 | -13.6% | -7.3% | +5.1% | +4.4% |
| September 2024 | -10.9% | -3.5% | +4.8% | +2.9% |
| August 2024 | -4.2% | -0.1% | +7.8% | +3.4% |
| July 2024 | +0.8% | +2.7% | +5.7% | +2.9% |
| June 2024 | +1.9% | +8.1% | +8.0% | +4.4% |
| May 2024 | +3.1% | +17.7% | +6.3% | +4.5% |
| April 2024 | +1.5% | +25.4% | +6.9% | +4.5% |
| March 2024 | -1.4% | +29.6% | +9.4% | +4.6% |
| February 2024 | -3.9% | +35.5% | +7.9% | +4.6% |
| January 2024 | -6.4% | +38.6% | +9.8% | +6.0% |
| December 2023 | -8.0% | +43.8% | +8.3% | +5.5% |
| November 2023 | -7.7% | +46.4% | +6.5% | +5.7% |
| October 2023 | -5.2% | +51.2% | +8.6% | +5.5% |
| September 2023 | -7.7% | +51.7% | +9.2% | +6.5% |
| August 2023 | -15.2% | +52.9% | +7.7% | +6.3% |
| July 2023 | -24.4% | +53.4% | +9.3% | +3.5% |
| June 2023 | -22.3% | +50.9% | +7.4% | +3.1% |
| May 2023 | -13.0% | +43.1% | +8.4% | +4.9% |
| April 2023 | -9.9% | +40.8% | +9.6% | +3.6% |
| March 2023 | -8.4% | +38.6% | +6.4% | +3.9% |
| February 2023 | +0.3% | +34.8% | +7.3% | +4.4% |
| January 2023 | +3.0% | +28.0% | +7.2% | +4.1% |
| December 2022 | +6.5% | +31.5% | +8.3% | +4.8% |
| November 2022 | +12.2% | +30.2% | +8.4% | +4.2% |
| October 2022 | +18.0% | +21.6% | +8.2% | +5.3% |
| September 2022 | +23.4% | +17.6% | +7.6% | +4.2% |
| August 2022 | +30.2% | +14.3% | +7.1% | +2.2% |
| July 2022 | +42.9% | +14.5% | +5.6% | +5.4% |
| June 2022 | +41.8% | +9.5% | +6.6% | +5.8% |
| May 2022 | +30.4% | +8.8% | +6.7% | +4.5% |
| April 2022 | +28.9% | +8.1% | +6.2% | +7.6% |
| March 2022 | +29.5% | +6.3% | +6.0% | +6.8% |
| February 2022 | +22.8% | +5.7% | +5.9% | +6.4% |
| January 2022 | +24.4% | +5.0% | +4.6% | +5.6% |
| December 2021 | +27.8% | -3.9% | +4.5% | +2.8% |
| November 2021 | +29.5% | -4.4% | +3.3% | +3.0% |
| October 2021 | +22.5% | -5.6% | +2.3% | +2.6% |
| September 2021 | +19.0% | -4.3% | +2.3% | +3.7% |
| August 2021 | +19.0% | -5.5% | +2.5% | +5.8% |
| July 2021 | +19.1% | -8.5% | +4.1% | +5.9% |
| June 2021 | +21.8% | -11.6% | +1.8% | +4.8% |
| May 2021 | +19.7% | -13.4% | +1.6% | +3.6% |
| April 2021 | +15.1% | -15.3% | -0.2% | +2.0% |
| March 2021 | +3.6% | -16.8% | +0.5% | +2.7% |
| February 2021 | -3.5% | -14.6% | +1.4% | +2.7% |
| January 2021 | -8.1% | -11.3% | +1.1% | +3.2% |
| December 2020 | -8.4% | -8.6% | +0.8% | +3.2% |
| November 2020 | -10.3% | -7.8% | +1.7% | +3.4% |
| October 2020 | -10.5% | -4.3% | +2.4% | +3.4% |
| September 2020 | -10.9% | -2.3% | +2.1% | +2.8% |
| August 2020 | -11.8% | 0.0% | +1.6% | +2.7% |
| July 2020 | -12.5% | +1.3% | +1.0% | +2.3% |
| June 2020 | -16.9% | +4.3% | +2.1% | +2.1% |
| May 2020 | -17.2% | +4.2% | +2.4% | +2.6% |
| April 2020 | -12.1% | +7.5% | +3.4% | +2.3% |
| March 2020 | -0.7% | +12.2% | +3.3% | +1.8% |
| February 2020 | +4.5% | +9.3% | +3.0% | +2.2% |
| January 2020 | +6.2% | +8.9% | +3.3% | +1.8% |
| December 2019 | +2.4% | +8.6% | +2.5% | +2.1% |
| November 2019 | -2.0% | +7.1% | +2.7% | +1.6% |
| October 2019 | -3.2% | +2.7% | +2.2% | +1.8% |
| September 2019 | -2.3% | -0.1% | +2.3% | +1.8% |
| August 2019 | -0.2% | -0.5% | +2.3% | +2.3% |
| July 2019 | 0.0% | -1.0% | +2.3% | +2.6% |
| June 2019 | +0.1% | -0.2% | +3.1% | +2.9% |
| May 2019 | +2.4% | -0.9% | +2.6% | +3.2% |
| April 2019 | +2.8% | -5.0% | +2.6% | +3.2% |
| March 2019 | +0.9% | -8.9% | +2.8% | +2.5% |
| February 2019 | -1.5% | -10.9% | +2.4% | +2.4% |
| January 2019 | -1.2% | -11.7% | +2.6% | +2.6% |
| December 2018 | +1.5% | -11.3% | +3.3% | +2.9% |
| November 2018 | +7.6% | -13.8% | +3.4% | +2.6% |
| October 2018 | +11.5% | -9.3% | +3.3% | +2.2% |
| September 2018 | +10.2% | -8.9% | +3.3% | +2.0% |
| August 2018 | +11.2% | -8.6% | +3.5% | +1.6% |
| July 2018 | +11.7% | -8.5% | +3.4% | +2.4% |
| June 2018 | +11.1% | -6.0% | +3.0% | +2.2% |
| May 2018 | +7.6% | -3.5% | +3.4% | +2.6% |
| April 2018 | +2.8% | -1.3% | +3.1% | +2.7% |
Embed This Chart
Copy this code to add the chart to your website. Please keep the source link.
<iframe src="https://brumble.co.uk/data/cost-of-motoring-index/2026-10/embed/components" title="Motoring Prices From the ONS: Change on a Year Earlier, Brumble Cost of Motoring Index 2026-10" width="100%" height="640" style="border:0;" loading="lazy"></iframe>
<p>Source: <a href="https://brumble.co.uk/data/cost-of-motoring-index">Brumble Cost of Motoring Index</a></p>Fuel
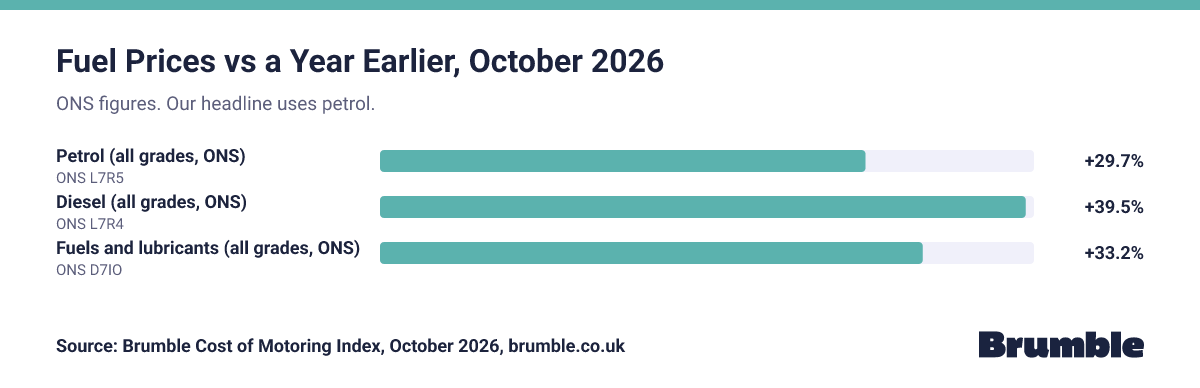
ONS figures show diesel prices (all grades) up 39.5% year on year in October 2026, against petrol (all grades) up 29.7%. Fuels and lubricants (all grades) were up 33.2%. Our Fuel Price Index puts Petrol (E10) at 172.40p a litre and Diesel (B7) at 198.62p, for 27 to 31 October 2026.
Our basket is a petrol car, so the headline uses the petrol price index (all grades, ONS). Diesel (all grades, ONS) and fuels and lubricants (all grades, ONS) are shown here on their own and are not in the headline.
ONS figures. Source: Brumble Cost of Motoring Index, October 2026, from ONS, GOV.UK and Brumble Fuel Price Index data. brumble.co.uk/data
| Fuel | Change on a Year Earlier | In Our Headline | ONS Series |
|---|---|---|---|
| Petrol (all grades, ONS) | +29.7% | Yes | L7R5 |
| Diesel (all grades, ONS) | +39.5% | No | L7R4 |
| Fuels and lubricants (all grades, ONS) | +33.2% | No | D7IO |
Embed This Chart
Copy this code to add the chart to your website. Please keep the source link.
<iframe src="https://brumble.co.uk/data/cost-of-motoring-index/2026-10/embed/fuel" title="Fuel Prices vs a Year Earlier, Brumble Cost of Motoring Index 2026-10" width="100%" height="380" style="border:0;" loading="lazy"></iframe>
<p>Source: <a href="https://brumble.co.uk/data/cost-of-motoring-index">Brumble Cost of Motoring Index</a></p>Latest Petrol Price, Brumble Fuel Price Index (October 2026)
172.40p a litre
Average UK petrol (E10) price, 27 to 31 October 2026. Diesel (B7): 198.62p.
Checking Against Our Fuel Price Index
Our Fuel Price Index has no figure for September 2026, so there is no earlier month to compare with yet.
We add a note here when our Fuel Price Index and the petrol figure (all grades, ONS) differ by 3 points or more. Until our index has a full year of figures (from the October 2027 edition), we compare the change on the month before. See the Brumble Fuel Price Index
Buying a Car, Tolls and Parking
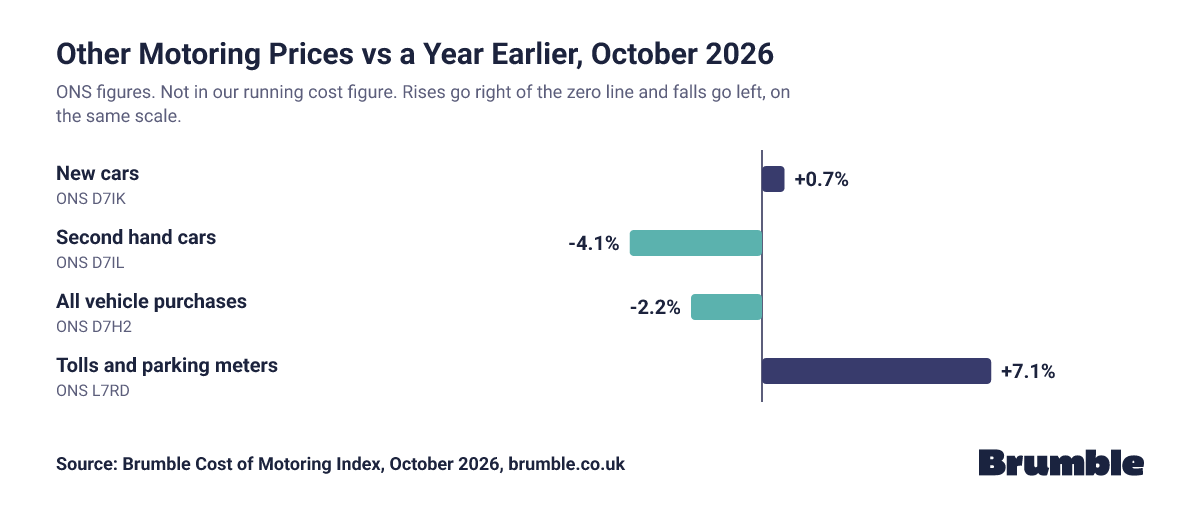
Buying a car tells a different story. Second-hand car prices were 4.1% lower than a year earlier, and all vehicle purchases 2.2% lower. New car prices rose 0.7%, and tolls and parking 7.1%. These are not part of our running cost figure.
These ONS figures are not in our running cost figure. We show them so you can see how they moved over the same year.
- Rise on a year earlier
- Fall on a year earlier
- New carsONS D7IK+0.7%
- Second hand carsONS D7IL-4.1%
- All vehicle purchasesONS D7H2-2.2%
- Tolls and parking metersONS L7RD+7.1%
Rises go right of the zero line and falls go left, on the same scale.
ONS figures. Not in our running cost figure. Source: Brumble Cost of Motoring Index, October 2026, from ONS, GOV.UK and Brumble Fuel Price Index data. brumble.co.uk/data
| Price | Change on a Year Earlier | ONS Series |
|---|---|---|
| New cars | +0.7% | D7IK |
| Second hand cars | -4.1% | D7IL |
| All vehicle purchases | -2.2% | D7H2 |
| Tolls and parking meters | +7.1% | L7RD |
Embed This Chart
Copy this code to add the chart to your website. Please keep the source link.
<iframe src="https://brumble.co.uk/data/cost-of-motoring-index/2026-10/embed/other-prices" title="Other Motoring Prices vs a Year Earlier, Brumble Cost of Motoring Index 2026-10" width="100%" height="480" style="border:0;" loading="lazy"></iframe>
<p>Source: <a href="https://brumble.co.uk/data/cost-of-motoring-index">Brumble Cost of Motoring Index</a></p>What This Means for Drivers
- If you drive more than 7,100 miles a year, petrol is a bigger part of your costs, so changes in petrol prices are likely to affect you more.
- Insurance prices can vary a lot between providers. Comparing quotes before you renew is a simple way to keep this cost down. Compare car insurance quotes
- Fuel prices vary between forecourts and regions. Our Fuel Price Index shows average prices by region.
- Your own costs depend on your car, where you live and how far you drive. Our cost of running a car guide has a calculator you can use.
For Journalists
Story Angles
- Running a petrol car cost about 16.6% more in October 2026 than a year before. Prices in general rose 3.6% (ONS CPI).
- The same car, driven the same 7,100 miles, cost about £385 a year more (about £32 a month).
- On a year earlier: Petrol added about £319 a year (+29.7%).
- This is a higher yearly rise than any month since September 2022, when it was 17.4%.
- Diesel prices (all grades, ONS) were +39.5% on a year earlier, against +29.7% for petrol (all grades, ONS), October 2026.
- Second hand car prices were -4.1% on a year earlier (ONS figure, October 2026). Car prices are not in our running cost figure.
- The maximum MOT fee for a car has not gone up since April 2010. It has been £54.85 since 1 April 2010, set by The Motor Vehicles (Tests) (Amendment) Regulations 2010 (SI 2010/449), and GOV.UK still lists £54.85.
Ready to Quote
Running a petrol car cost about 16.6% more in October 2026 than a year before, says the Brumble Cost of Motoring Index.
The same car cost about £385 more to run in October 2026 than a year before, says the Brumble Cost of Motoring Index.
Prices in general rose 3.6% in the year to October 2026. The cost of running a petrol car rose 16.6%, says the Brumble Cost of Motoring Index.
Key Numbers
- Change in the yearly cost of running a petrol car, October 2026 vs October 2025: +16.6% (Brumble Cost of Motoring Index)
- Yearly cost of a petrol car, October 2026: £2,712 (Brumble Cost of Motoring Index)
- Same car a year earlier, October 2025: £2,327 (Brumble Cost of Motoring Index)
- Extra cost a year for the same car: £385 (Brumble Cost of Motoring Index)
- Prices in general, October 2026 vs October 2025: +3.6% (ONS CPI, series D7G7)
- Petrol (all grades, ONS) prices, October 2026 vs October 2025: +29.7% (series L7R5)
- Diesel (all grades, ONS) prices, October 2026 vs October 2025: +39.5% (series L7R4)
- Fuels and lubricants (all grades, ONS) prices, October 2026 vs October 2025: +33.2% (series D7IO)
Ryan Hughes, founder of Brumble, said: "Our index suggests a petrol car cost about £385 more to run in October 2026 than a year before. Petrol added about £319 of that. It is worth comparing insurance quotes before you renew, and checking fuel prices near you before you fill up."
Notes to Editors
- The Brumble Cost of Motoring Index shows how much more or less it costs to run a petrol car in the UK than a year earlier. This edition compares October 2026 with October 2025.
- The basket is a petrol car driven 7,100 miles a year. That is the average for all cars in England (DfT National Travel Survey, NTS0901, 2025). We assume a petrol car that does 40mpg. It covers petrol, insurance, servicing and repairs, road tax and the MOT. Each cost is priced using ONS consumer price indices, GOV.UK road tax rates and MOT fees, and the Brumble Fuel Price Index.
- It does not include buying the car, finance, parking or breakdown cover. It is not a forecast.
- Brumble is a UK comparison service.
- Brumble's figures are free to use under the Creative Commons Attribution 4.0 licence (CC BY 4.0). ONS and GOV.UK data is licensed under the Open Government Licence v3.0.
- How to cite: Source: Brumble Cost of Motoring Index, October 2026, published 18 November 2026, brumble.co.uk/data/cost-of-motoring-index/2026-10
Press Contact
For comment, interviews or more detail on the data, email contact@brumble.co.uk or visit our press office.
Cite This Index
Plain Text
Source: Brumble Cost of Motoring Index, October 2026, published 18 November 2026, brumble.co.uk/data/cost-of-motoring-index/2026-10
Harvard
Brumble (2026) Brumble Cost of Motoring Index: October 2026. Published 18 November 2026. Available at: https://brumble.co.uk/data/cost-of-motoring-index/2026-10 (Accessed: date)
HTML Link
<a href="https://brumble.co.uk/data/cost-of-motoring-index/2026-10">Brumble Cost of Motoring Index</a>
Brumble Cost of Motoring Index Methodology
How the figure works
- We take the yearly cost of the basket at October 2026 prices and divide it by the cost of the same basket at October 2025 prices. The basket stays the same, so only prices change.
- The cash figure comes from the same sum, so the percentage and the pounds always agree.
- It is not a forecast. It compares one month with the same month a year earlier.
Each cost
- Petrol: the petrol price index (all grades, ONS), series L7FP, gives the change. The cost in pounds uses our Fuel Price Index petrol (E10) average for the same month as the ONS figures. If our Fuel Price Index for that month is not published yet, the edition stays a draft. Petrol is priced at 172.40p a litre, our Fuel Price Index average for October 2026. That edition covers 27 to 31 October 2026 only (5 days).
- Insurance: the ONS motor vehicle insurance index (L7JE). This leaves out travel insurance, which the wider ONS transport insurance group includes. The cost in pounds is £566, the ABI average premium, Q2 2026. The basket keeps this figure fixed for 2026.
- Servicing and repairs: the ONS maintenance and repairs index (D7ED) for labour and the spare parts and accessories index (D7EB) for parts. The cost in pounds is £500, a Brumble allowance. We split the cost using ONS 2026 weights: 80.5% labour and 19.5% parts.
- Road tax: the GOV.UK standard rate for a car first registered from April 2017 (£200 from 1 April 2026, £195 from 1 April 2025). It does not include the extra charge for cars that cost over £40,000. The ONS includes road tax in its prices but does not publish it on its own, so we use the GOV.UK rate and do not count it twice.
- MOT: We use £54.85, the maximum MOT fee for a car (GOV.UK, unchanged since 1 April 2010). Test centres cannot charge more than this. It is set for Great Britain and has been £54.85 since 1 April 2010, so we count no change while it stays the same.
Back to April 2018
- The monthly figures from April 2018 use the 2026 basket, priced with the same ONS indices and the road tax rate in force in each month. April 2018 is the first month where both it and the month a year earlier use the flat road tax rate that started in April 2017.
- Lines labelled as ONS figures are the ONS published annual rates, not our own figures.
Checks
- Using the ONS's own weights for the same running costs gives +15.3% for October 2026, close to the ONS figure for running a vehicle (+15.7%). We do not use those weights for the headline, because insurance gets only 3.2% of the weight there. The ONS weights insurance by premiums minus claims paid out, not by what drivers pay.
- We compare our Fuel Price Index with the petrol figure (all grades, ONS) each month and add a note when they differ by 3 points or more.
- This edition uses ONS figures released on 18 November 2026. The next ONS release is on 16 December 2026. We keep a copy of every ONS series we use, so each edition can be checked.
Where the figures apply
The ONS prices, road tax rates and our Fuel Price Index cover the UK. The MOT fee is set for Great Britain. The miles a year are the average for cars in England.
Methodology version: 1.0.
Sources
- Consumer price inflation time series (MM23), Office for National Statistics (ONS). Contains public sector information licensed under the Open Government Licence v3.0.
- Vehicle tax rate tables, Driver and Vehicle Licensing Agency (DVLA), GOV.UK. Contains public sector information licensed under the Open Government Licence v3.0. Past rates from the Vehicle Excise and Registration Act 1994, Schedule 1, paragraph 1GD, on legislation.gov.uk.
- Getting an MOT: MOT costs, Driver and Vehicle Standards Agency (DVSA), GOV.UK. Contains public sector information licensed under the Open Government Licence v3.0.
- Brumble Fuel Price Index, Brumble. Used for the petrol price in the basket.
- Vehicle mileage and occupancy (NTS0901), Department for Transport (DfT), National Travel Survey, GOV.UK. Contains public sector information licensed under the Open Government Licence v3.0. Used for the miles a year in the 2026 basket: the average for all cars in England (DfT National Travel Survey, NTS0901, 2025).
- ABI average premium, Q2 2026, Association of British Insurers (ABI). Used for the insurance cost in the 2026 basket. The basket keeps this figure fixed for 2026.
The Brumble Cost of Motoring Index shows how much more or less it costs to run a petrol car in the UK than a year earlier. It prices a fixed basket of petrol, insurance, servicing, road tax and the MOT using ONS price indices, GOV.UK rates and the Brumble Fuel Price Index.
Licence
Brumble's tables, charts and figures are licensed under the Creative Commons Attribution 4.0 licence (CC BY 4.0). You can use them, including for commercial use, as long as you credit Brumble.
ONS, DVLA and DVSA data contains public sector information licensed under the Open Government Licence v3.0.
Download the Data
You can use these figures for free. Please credit Brumble and link to this page. Each file starts with notes rows that begin with #.
Corrections
No corrections have been made to this edition.
Questions and Answers
Our index suggests running a petrol car cost about 16.6% more in October 2026 than in October 2025. For the same car and the same 7,100 miles, that is about £2,712 a year, against about £2,327 a year earlier.
Against October 2025: Petrol added about £319 a year (+29.7%). Insurance added about £39 a year (+7.3%). Servicing and repairs (labour) added about £20 a year (+5.3%). Road tax added about £5 a year (+2.6%). Servicing and repairs (parts) added about £3 a year (+2.8%). MOT did not change. Figures are rounded to the nearest pound, so they may not add up exactly to the total.
Prices in general rose 3.6% in the year to October 2026, on the ONS consumer prices index (CPI). The cost of running a petrol car changed by more than that, at +16.6%.
A petrol car driven 7,100 miles a year. That is the average for all cars in England (DfT National Travel Survey, NTS0901, 2025). We assume a petrol car that does 40mpg. The basket covers petrol, insurance, servicing and repairs, road tax and the MOT. It leaves out buying the car, finance, parking and breakdown cover. We review it each January.
The basket is a petrol car, so the headline uses the petrol price index (all grades, ONS). We show diesel and fuels and lubricants on their own lines. In October 2026, diesel prices (all grades, ONS) were +39.5% and fuels and lubricants (all grades, ONS) +33.2% on a year earlier.
Yes. We use the GOV.UK standard rate for a car first registered from April 2017: £200 a year from 1 April 2026, against £195 a year earlier. It does not include the extra charge for cars that cost over £40,000.
No. It compares prices in October 2026 with prices a year earlier. It does not say what prices will do next.
Yes. Our figures are free to use under the Creative Commons Attribution 4.0 licence. Please credit the Brumble Cost of Motoring Index and link to this page.
Previous Editions
This is the first edition. We plan to publish a new edition each month, after the ONS releases its consumer price figures.