

 EV Zone
2025 Edition · Published 4 November 2026
Brumble MOT Reliability Index 2025
Which car brands pass their MOT first time most often? We looked at the first MOT test of 28.8 million cars tested in Great Britain in 2025, and allowed for how old each car was.
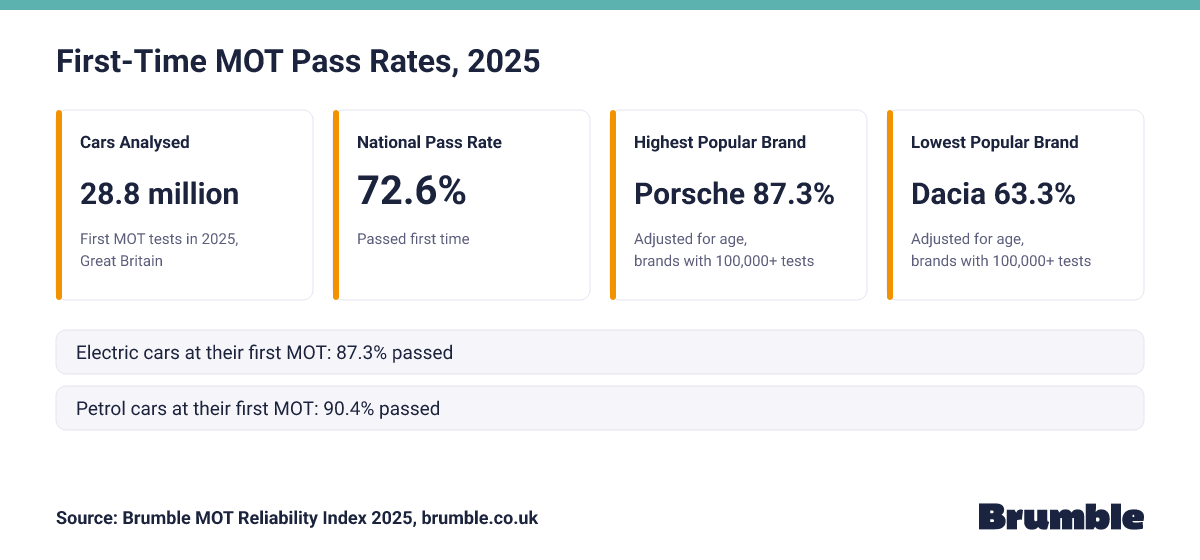
In 2025 MOT tests across Great Britain, Porsche had the highest first-time pass rate of any popular car brand, once age is taken into account. Dacia had the lowest.
Popular brands are those with 100,000 or more tests. These are MOT results only. They do not tell you about breakdowns or repair costs.
Key Figures
Cars Analysed
28.8 million
First MOT tests in 2025, Great Britain
National Pass Rate
72.6%
Passed first time
Highest Popular Brand
Porsche 87.3%
Adjusted for age, brands with 100,000+ tests
Lowest Popular Brand
Dacia 63.3%
Adjusted for age, brands with 100,000+ tests
Electric cars at their first MOT: 87.3% passed
Petrol cars at their first MOT: 90.4% passed
Embed This Chart
Copy this code to add the chart to your website. Please keep the source link.
<iframe src="https://brumble.co.uk/data/mot-reliability-index/2025/embed/key-figures" title="First-Time MOT Pass Rates: Key Figures, Brumble MOT Reliability Index 2025" width="100%" height="640" style="border:0;" loading="lazy"></iframe>
<p>Source: <a href="https://brumble.co.uk/data/mot-reliability-index">Brumble MOT Reliability Index</a></p>Want to Check a Specific Vehicle?
This index shows pass rates across all cars tested in 2025. To check the MOT status and history of a specific vehicle, use our free MOT checker.
Check a vehicle's MOTWhat This Index Shows
- It shows how often cars pass their MOT first time, by brand and by model.
- It does not measure breakdowns, repair costs or how reliable a car is mechanically.
- Many MOT failures are for parts that wear out, like bulbs, tyres and wiper blades. How well a car is looked after matters as much as how it was made.
- Older cars fail more often. Some brands sell mostly new cars and some have lots of older ones, so we adjust for age to compare them more fairly.
- The figures cover MOT tests in Great Britain (England, Scotland and Wales).
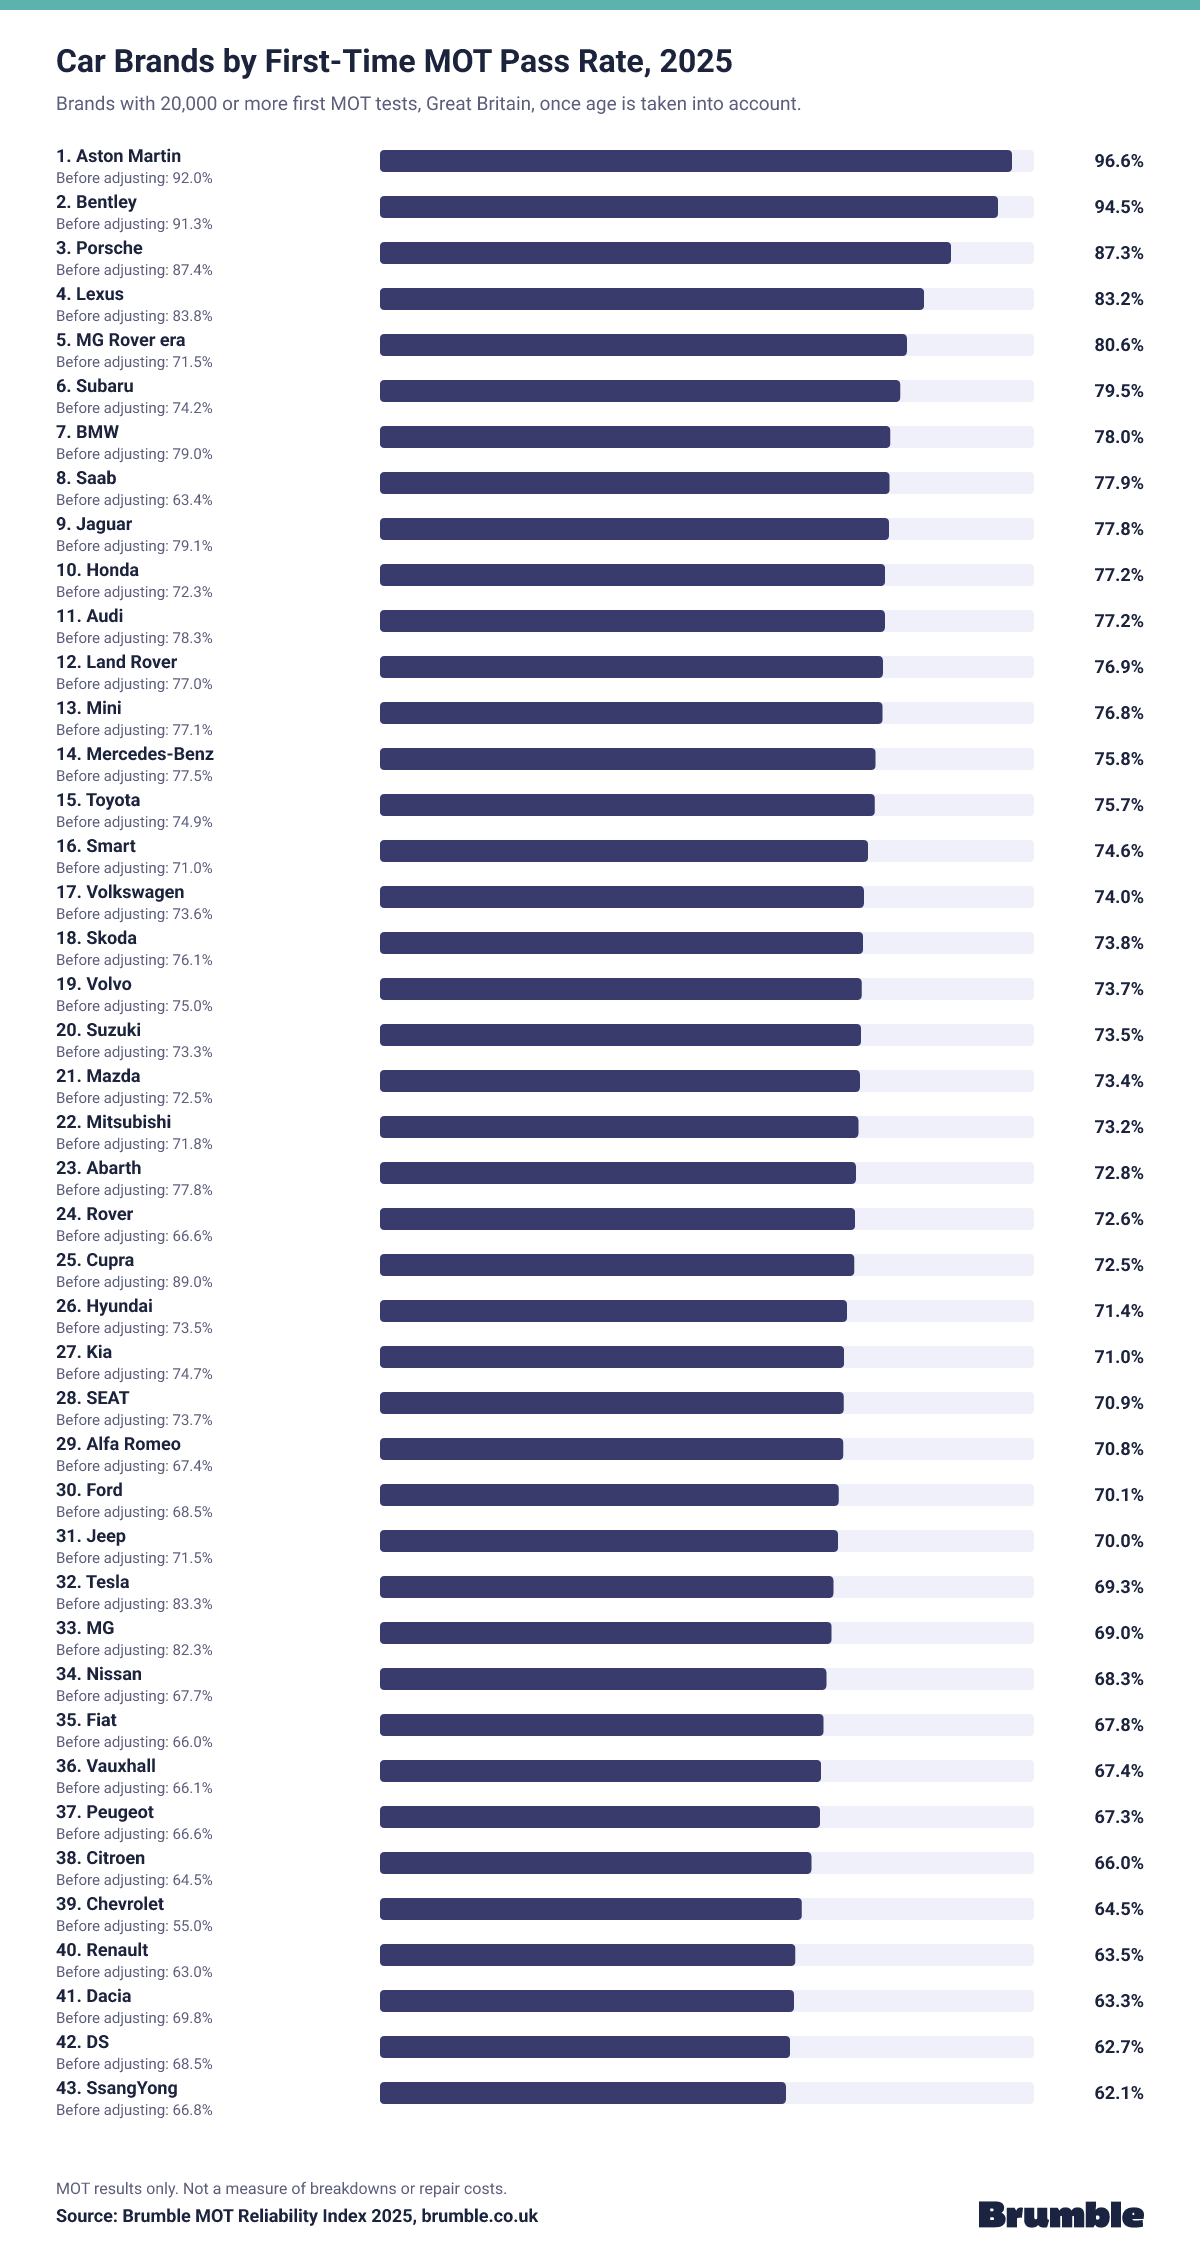
Car Brands Ranked by First-Time MOT Pass Rate
This list covers car brands with 20,000 or more first MOT tests. The adjusted rate is the pass rate after allowing for the age of each brand's cars. All cars passed 72.6% of the time.
- Pass rate: the share of cars that passed first time.
- Expected: the pass rate we would expect, given how old the brand's cars are.
- Adjusted for age: the pass rate if the brand's cars had the same age mix as all cars.
- Miles vs same age: how far the brand's cars had driven, compared with other cars of the same age. We do not adjust for this.
Source: Brumble MOT Reliability Index, 2025 edition, from DVSA MOT data. brumble.co.uk/data
Embed This Chart
Copy this code to add the chart to your website. Please keep the source link.
<iframe src="https://brumble.co.uk/data/mot-reliability-index/2025/embed/brand-ranking" title="Car Brands by First-Time MOT Pass Rate, Adjusted for Age, Brumble MOT Reliability Index 2025" width="100%" height="2250" style="border:0;" loading="lazy"></iframe>
<p>Source: <a href="https://brumble.co.uk/data/mot-reliability-index">Brumble MOT Reliability Index</a></p>Full Table
| Rank | Brand | Adjusted for Age | Pass Rate | Expected | Tests | Average Age | Miles vs Same Age | Why It Moved |
|---|---|---|---|---|---|---|---|---|
| 1 | Aston Martin | 96.6% | 92.0% | 69.1% | 22,144 | 13.4 years | 60% less | |
| 2 | Bentley | 94.5% | 91.3% | 70.1% | 22,313 | 13.6 years | 43% less | |
| 3 | Porsche | 87.3% | 87.4% | 72.6% | 183,246 | 12.1 years | 20% less | |
| 4 | Lexus | 83.2% | 83.8% | 73.1% | 162,856 | 10.0 years | 8% more | |
| 5 | MG Rover era | 80.6% | 71.5% | 64.4% | 25,252 | 24.3 years | 39% less | Moves up 22 places once we allow for age. Its cars are older: 24.3 years old on average, against 10.1 for all cars. They cover about 39% fewer miles than other cars of the same age. |
| 6 | Subaru | 79.5% | 74.2% | 67.7% | 54,650 | 13.7 years | About average | Moves up 13 places once we allow for age. Its cars are older: 13.7 years old on average, against 10.1 for all cars. |
| 7 | BMW | 78.0% | 79.0% | 73.5% | 1,796,153 | 9.8 years | 15% more | |
| 8 | Saab | 77.9% | 63.4% | 59.0% | 40,299 | 18.5 years | 12% more | Moves up 33 places once we allow for age. Its cars are older: 18.5 years old on average, against 10.1 for all cars. |
| 9 | Jaguar | 77.8% | 79.1% | 73.8% | 330,578 | 10.3 years | About average | |
| 10 | Honda | 77.2% | 72.3% | 67.9% | 868,822 | 12.3 years | About average | Moves up 15 places once we allow for age. Its cars are older: 12.3 years old on average, against 10.1 for all cars. |
| 11 | Audi | 77.2% | 78.3% | 73.5% | 1,691,335 | 9.4 years | 15% more | |
| 12 | Land Rover | 76.9% | 77.0% | 72.6% | 895,907 | 11.0 years | 19% more | |
| 13 | Mini | 76.8% | 77.1% | 72.8% | 784,435 | 9.8 years | 14% less | |
| 14 | Mercedes-Benz | 75.8% | 77.5% | 74.2% | 1,519,818 | 9.6 years | 8% more | |
| 15 | Toyota | 75.7% | 74.9% | 71.9% | 1,538,610 | 10.6 years | About average | |
| 16 | Smart | 74.6% | 71.0% | 69.0% | 85,461 | 11.5 years | 34% less | Moves up 13 places once we allow for age. They cover about 34% fewer miles than other cars of the same age. |
| 17 | Volkswagen | 74.0% | 73.6% | 72.2% | 2,479,255 | 10.2 years | 7% more | |
| 18 | Skoda | 73.8% | 76.1% | 74.8% | 781,009 | 8.8 years | 10% more | |
| 19 | Volvo | 73.7% | 75.0% | 73.9% | 581,911 | 9.7 years | 23% more | |
| 20 | Suzuki | 73.5% | 73.3% | 72.3% | 420,189 | 10.2 years | 19% less | |
| 21 | Mazda | 73.4% | 72.5% | 71.7% | 513,443 | 10.8 years | 8% less | |
| 22 | Mitsubishi | 73.2% | 71.8% | 71.2% | 182,279 | 11.0 years | 7% more | |
| 23 | Abarth | 72.8% | 77.8% | 77.6% | 28,689 | 7.6 years | 27% less | Moves down 12 places once we allow for age. Its cars are young: 7.6 years old on average, against 10.1 for all cars. They cover about 27% fewer miles than other cars of the same age. |
| 24 | Rover | 72.6% | 66.6% | 66.5% | 26,074 | 25.8 years | 29% less | Moves up 13 places once we allow for age. Its cars are older: 25.8 years old on average, against 10.1 for all cars. They cover about 29% fewer miles than other cars of the same age. |
| 25 | Cupra | 72.5% | 89.0% | 89.1% | 21,889 | 2.6 years | About average | Moves down 22 places once we allow for age. Its cars are young: 2.6 years old on average, against 10.1 for all cars. |
| 26 | Hyundai | 71.4% | 73.5% | 74.7% | 911,200 | 8.7 years | 11% less | |
| 27 | Kia | 71.0% | 74.7% | 76.4% | 974,390 | 8.0 years | 6% less | |
| 28 | SEAT | 70.9% | 73.7% | 75.4% | 538,384 | 8.5 years | 7% more | |
| 29 | Alfa Romeo | 70.8% | 67.4% | 69.0% | 64,252 | 11.9 years | About average | |
| 30 | Ford | 70.1% | 68.5% | 70.9% | 3,444,855 | 10.6 years | About average | |
| 31 | Jeep | 70.0% | 71.5% | 74.0% | 71,736 | 10.1 years | About average | |
| 32 | Tesla | 69.3% | 83.3% | 87.2% | 128,351 | 3.6 years | 38% more | Moves down 26 places once we allow for age. Its cars are young: 3.6 years old on average, against 10.1 for all cars. They cover about 38% more miles than other cars of the same age. |
| 33 | MG | 69.0% | 82.3% | 86.5% | 133,005 | 3.9 years | 7% less | Moves down 26 places once we allow for age. Its cars are young: 3.9 years old on average, against 10.1 for all cars. |
| 34 | Nissan | 68.3% | 67.7% | 72.0% | 1,487,995 | 10.1 years | 6% less | |
| 35 | Fiat | 67.8% | 66.0% | 70.6% | 578,162 | 10.4 years | 24% less | |
| 36 | Vauxhall | 67.4% | 66.1% | 71.2% | 2,421,592 | 10.3 years | About average | |
| 37 | Peugeot | 67.3% | 66.6% | 71.9% | 1,051,480 | 10.2 years | 9% less | |
| 38 | Citroen | 66.0% | 64.5% | 70.9% | 697,741 | 10.5 years | 10% less | |
| 39 | Chevrolet | 64.5% | 55.0% | 61.9% | 48,353 | 14.5 years | 23% less | |
| 40 | Renault | 63.5% | 63.0% | 72.0% | 751,708 | 10.1 years | 8% less | |
| 41 | Dacia | 63.3% | 69.8% | 80.0% | 209,712 | 6.6 years | 6% less | Moves down 11 places once we allow for age. Its cars are young: 6.6 years old on average, against 10.1 for all cars. |
| 42 | DS | 62.7% | 68.5% | 79.2% | 44,745 | 7.0 years | 9% less | Moves down 10 places once we allow for age. Its cars are young: 7.0 years old on average, against 10.1 for all cars. |
| 43 | SsangYong | 62.1% | 66.8% | 78.1% | 21,822 | 7.4 years | About average |
Search All Brands by Fuel and Age
Search every brand with 2,000 or more tests. You can look at one fuel type, or at cars of one age.
Showing 63 brands: All cars. We show a figure when it is based on 2,000 tests or more.
| Brand | Adjusted for Age | Pass Rate | Tests |
|---|---|---|---|
| Aston Martin | 96.6% | 92.0% | 22,144 |
| Ferrari | 95.4% | 94.8% | 14,188 |
| TVR | 95.1% | 87.8% | 5,743 |
| Bentley | 94.5% | 91.3% | 22,313 |
| Caterham | 94.5% | 89.2% | 3,569 |
| Lotus | 91.8% | 86.2% | 9,636 |
| Morgan | 91.4% | 87.8% | 5,866 |
| Rolls-Royce | 90.6% | 92.5% | 5,195 |
| Lamborghini | 90.2% | 96.1% | 3,706 |
| Porsche | 87.3% | 87.4% | 183,246 |
| McLaren | 87.3% | 95.3% | 2,924 |
| Lexus | 83.2% | 83.8% | 162,856 |
| Maserati | 82.0% | 83.0% | 11,000 |
| Perodua | 81.5% | 66.9% | 2,193 |
| MG Rover era | 80.6% | 71.5% | 25,252 |
| Subaru | 79.5% | 74.2% | 54,650 |
| Triumph | 79.5% | 82.7% | 4,963 |
| Dodge | 78.5% | 69.1% | 5,644 |
| BMW | 78.0% | 79.0% | 1,796,153 |
| Saab | 77.9% | 63.4% | 40,299 |
| Jaguar | 77.8% | 79.1% | 330,578 |
| Honda | 77.2% | 72.3% | 868,822 |
| Audi | 77.2% | 78.3% | 1,691,335 |
| Morris | 77.0% | 80.5% | 2,505 |
| Land Rover | 76.9% | 77.0% | 895,907 |
| Mini | 76.8% | 77.1% | 784,435 |
| Mercedes-Benz | 75.8% | 77.5% | 1,519,818 |
| Toyota | 75.7% | 74.9% | 1,538,610 |
| Infiniti | 75.6% | 78.1% | 9,248 |
| Smart | 74.6% | 71.0% | 85,461 |
| Daihatsu | 74.3% | 60.6% | 14,141 |
| Volkswagen | 74.0% | 73.6% | 2,479,255 |
| Skoda | 73.8% | 76.1% | 781,009 |
| Volvo | 73.7% | 75.0% | 581,911 |
| Suzuki | 73.5% | 73.3% | 420,189 |
| Mazda | 73.4% | 72.5% | 513,443 |
| Mitsubishi | 73.2% | 71.8% | 182,279 |
| Chrysler | 73.0% | 60.8% | 18,859 |
| Austin | 73.0% | 76.2% | 3,892 |
| Abarth | 72.8% | 77.8% | 28,689 |
| Rover | 72.6% | 66.6% | 26,074 |
| Cupra | 72.5% | 89.0% | 21,889 |
| LEVC | 72.3% | 80.4% | 16,540 |
| Hyundai | 71.4% | 73.5% | 911,200 |
| Polestar | 71.0% | 87.1% | 12,714 |
| Kia | 71.0% | 74.7% | 974,390 |
| SEAT | 70.9% | 73.7% | 538,384 |
| Alfa Romeo | 70.8% | 67.4% | 64,252 |
| Ford | 70.1% | 68.5% | 3,444,855 |
| Jeep | 70.0% | 71.5% | 71,736 |
| Tesla | 69.3% | 83.3% | 128,351 |
| MG | 69.0% | 82.3% | 133,005 |
| Nissan | 68.3% | 67.7% | 1,487,995 |
| Fiat | 67.8% | 66.0% | 578,162 |
| Isuzu | 67.6% | 58.4% | 4,031 |
| Vauxhall | 67.4% | 66.1% | 2,421,592 |
| Peugeot | 67.3% | 66.6% | 1,051,480 |
| Citroen | 66.0% | 64.5% | 697,741 |
| Chevrolet | 64.5% | 55.0% | 48,353 |
| Renault | 63.5% | 63.0% | 751,708 |
| Dacia | 63.3% | 69.8% | 209,712 |
| DS | 62.7% | 68.5% | 44,745 |
| SsangYong | 62.1% | 66.8% | 21,822 |
Specialist and Smaller Brands
These brands had between 2,000 and 19,999 first MOT tests. Many are sports or luxury cars that are driven less and looked after closely, so take care comparing them with everyday brands.
| Brand | Adjusted for Age | Pass Rate | Expected | Tests | Average Age | Miles vs Same Age |
|---|---|---|---|---|---|---|
| Ferrari | 95.4% | 94.8% | 72.1% | 14,188 | 14.2 years | 73% less |
| TVR | 95.1% | 87.8% | 67.0% | 5,743 | 26.2 years | 47% less |
| Caterham | 94.5% | 89.2% | 68.5% | 3,569 | 17.5 years | 77% less |
| Lotus | 91.8% | 86.2% | 68.1% | 9,636 | 20.4 years | 48% less |
| Morgan | 91.4% | 87.8% | 69.8% | 5,866 | 17.7 years | 70% less |
| Rolls-Royce | 90.6% | 92.5% | 74.2% | 5,195 | 16.9 years | 41% less |
| Lamborghini | 90.2% | 96.1% | 77.3% | 3,706 | 8.8 years | 65% less |
| McLaren | 87.3% | 95.3% | 79.3% | 2,924 | 7.1 years | 72% less |
| Maserati | 82.0% | 83.0% | 73.4% | 11,000 | 10.2 years | 28% less |
| Perodua | 81.5% | 66.9% | 59.6% | 2,193 | 15.6 years | 38% less |
| Triumph | 79.5% | 82.7% | 75.6% | 4,963 | 29.6 years | 45% less |
| Dodge | 78.5% | 69.1% | 63.9% | 5,644 | 15.7 years | About average |
| Morris | 77.0% | 80.5% | 75.8% | 2,505 | 29.9 years | 48% less |
| Infiniti | 75.6% | 78.1% | 74.9% | 9,248 | 8.6 years | 8% more |
| Daihatsu | 74.3% | 60.6% | 59.1% | 14,141 | 19.3 years | 24% less |
| Chrysler | 73.0% | 60.8% | 60.4% | 18,859 | 15.9 years | 6% less |
| Austin | 73.0% | 76.2% | 75.8% | 3,892 | 29.8 years | 46% less |
| LEVC | 72.3% | 80.4% | 80.7% | 16,540 | 6.3 years | 159% more |
| Polestar | 71.0% | 87.1% | 89.0% | 12,714 | 2.6 years | 32% more |
| Isuzu | 67.6% | 58.4% | 62.6% | 4,031 | 19.6 years | 28% more |
Not Enough Tests Yet
Cars have their first MOT when they are 3 years old. These newer brands have not had enough MOT tests yet for us to show a pass rate.
| Brand | First MOT Tests in 2025 |
|---|---|
| Genesis | 1,037 |
| Alpine | 836 |
| BYD | 379 |
| GWM Ora | 43 |
| Ineos | 20 |
| Jaecoo | 8 |
| Chery | 7 |
| Fisker | 6 |
| Omoda | 6 |
| KGM | 3 |
| Leapmotor | None yet |
| Lynk & Co | None yet |
| Skywell | None yet |
| VinFast | None yet |
| Xpeng | None yet |
| Zeekr | None yet |
Car Models
Every car model with 2,000 or more first MOT tests. We group the model names in the MOT data into the names people know, so FOCUS ZETEC and FOCUS ST-LINE both count as Focus.
When two different cars share a name, we split them by the year they were first used, for example Puma (up to 2002) and Puma (2019 on).
"Compared with cars the same age" shows how many percentage points a model's pass rate was above or below what we would expect, given how old its cars were. For example, +5.0 points means it passed 5 points more often than cars of the same ages usually do.
Showing the first 25 of 495 models. Loading the rest.
| Model | Pass Rate | Compared With Cars the Same Age | Average Age | Tests |
|---|---|---|---|---|
| Aston Martin V8 Vantage | 91.4% | 33.3 points above | 17.0 years | 3,031 |
| Aston Martin DB9 | 90.1% | 30.4 points above | 16.5 years | 4,026 |
| Nissan GT-R | 95.3% | 28.1 points above | 11.6 years | 2,315 |
| Bentley Continental | 91.6% | 24.2 points above | 13.0 years | 14,099 |
| Honda S2000 | 82.5% | 24.1 points above | 20.2 years | 4,700 |
| Audi R8 | 90.8% | 22.9 points above | 11.5 years | 3,642 |
| Lotus Elise | 86.1% | 22.0 points above | 20.1 years | 4,897 |
| BMW M5 | 87.5% | 21.6 points above | 15.2 years | 3,666 |
| Porsche 911 | 89.0% | 20.7 points above | 16.1 years | 50,363 |
| BMW M3 | 86.7% | 20.6 points above | 15.4 years | 15,786 |
| Aston Martin Vantage | 93.7% | 19.6 points above | 9.4 years | 4,935 |
| Toyota Vellfire | 83.0% | 19.6 points above | 12.9 years | 3,315 |
| Jaguar XK | 80.2% | 18.9 points above | 15.3 years | 7,842 |
| TVR Chimaera | 86.5% | 18.9 points above | 27.1 years | 2,335 |
| Porsche Cayman | 89.1% | 18.6 points above | 10.7 years | 14,930 |
| Porsche Boxster | 82.5% | 18.5 points above | 16.9 years | 30,974 |
| Mercedes-Benz SL | 82.8% | 17.5 points above | 18.8 years | 19,892 |
| Audi A8 | 86.9% | 16.8 points above | 11.2 years | 10,538 |
| Jaguar XKR | 76.1% | 16.7 points above | 18.7 years | 7,789 |
| Lexus LS | 78.8% | 16.6 points above | 19.8 years | 2,991 |
| Lexus GS | 80.6% | 16.5 points above | 14.9 years | 6,978 |
| Audi RS4 | 87.5% | 15.7 points above | 11.0 years | 2,189 |
| Mercedes-Benz GL | 81.8% | 15.6 points above | 12.1 years | 3,287 |
| Honda Fit | 81.0% | 15.3 points above | 11.8 years | 5,037 |
| Nissan 350 Z | 73.4% | 14.7 points above | 18.1 years | 4,521 |
Vans and Pickups
Vans and pickups are not in the car tables. Here we compare them with each other. They include larger vans, which take a different MOT (class 7). We adjust for age against all vans and pickups, which passed 65.2% of the time.
The MOT data does not say whether a vehicle is a van or a people carrier. Some small vans share a name with a passenger version, so those rows include both. Some larger vans are made into motorhomes.
Vans
| Model | Adjusted for Age | Pass Rate | Tests | Average Age | Notes |
|---|---|---|---|---|---|
| Toyota Hiace | 76.8% | 64.5% | 12,445 | 19.1 years | May include motorhomes built on this van |
| Fiat Ducato | 75.6% | 70.3% | 89,073 | 13.8 years | May include motorhomes built on this van |
| Volkswagen Transporter | 71.0% | 68.1% | 325,585 | 12.3 years | May include motorhomes built on this van |
| Volkswagen Caddy | 70.7% | 68.0% | 142,293 | 10.2 years | Includes passenger versions |
| Peugeot Boxer | 68.5% | 68.0% | 103,417 | 10.4 years | May include motorhomes built on this van |
| MAN TGE | 68.3% | 79.5% | 8,417 | 3.7 years | |
| Mercedes-Benz Vito | 67.9% | 67.4% | 89,416 | 9.5 years | |
| Ford Transit Custom | 67.2% | 77.0% | 209,104 | 4.2 years | |
| Mercedes-Benz Sprinter | 66.9% | 68.5% | 205,448 | 8.5 years | May include motorhomes built on this van |
| Fiat Doblo | 66.2% | 62.4% | 41,079 | 10.9 years | Includes passenger versions |
| Ford Transit Connect | 66.2% | 66.2% | 156,653 | 9.3 years | Includes passenger versions |
| Peugeot Expert | 65.8% | 68.1% | 63,485 | 7.9 years | |
| Vauxhall Astravan | 65.5% | 54.3% | 5,990 | 17.3 years | |
| Volkswagen Crafter | 65.1% | 67.6% | 65,712 | 7.6 years | May include motorhomes built on this van |
| Ford Transit Courier | 64.4% | 70.3% | 29,885 | 5.8 years | Includes passenger versions |
| Iveco Daily | 64.1% | 64.3% | 36,202 | 9.4 years | May include motorhomes built on this van |
| Toyota Proace | 64.1% | 70.4% | 14,940 | 5.6 years | |
| Toyota Proace City | 63.8% | 75.0% | 3,659 | 2.7 years | Includes passenger versions |
| Ford Transit | 63.7% | 62.4% | 563,703 | 9.9 years | May include motorhomes built on this van |
| Citroen Nemo | 63.3% | 56.4% | 11,884 | 12.1 years | Includes passenger versions |
| Volkswagen LT | 63.3% | 53.0% | 5,597 | 22.1 years | May include motorhomes built on this van |
| Renault Master | 62.2% | 61.8% | 73,940 | 9.9 years | May include motorhomes built on this van |
| Fiat Fiorino | 62.0% | 61.2% | 7,718 | 9.0 years | Includes passenger versions |
| Peugeot Partner | 62.0% | 61.8% | 143,955 | 8.9 years | Includes passenger versions |
| Peugeot Bipper | 61.9% | 55.5% | 16,668 | 11.8 years | Includes passenger versions |
| Fiat Talento | 61.5% | 68.3% | 2,972 | 5.3 years | |
| Citroen Relay | 61.3% | 62.7% | 64,825 | 8.3 years | May include motorhomes built on this van |
| Vauxhall Combo | 61.3% | 61.6% | 93,703 | 9.3 years | Includes passenger versions |
| Nissan NV300 | 61.1% | 68.5% | 3,160 | 5.1 years | |
| LDV Maxus | 60.9% | 50.5% | 3,807 | 17.3 years | |
| LDV V80 | 60.6% | 67.6% | 2,170 | 5.5 years | |
| Vauxhall Corsavan | 60.3% | 50.9% | 2,828 | 15.4 years | |
| Citroen Dispatch | 60.1% | 61.5% | 52,810 | 8.3 years | |
| Nissan Interstar | 59.6% | 64.1% | 2,266 | 6.9 years | |
| Citroen Berlingo | 59.6% | 58.5% | 173,728 | 9.8 years | Includes passenger versions |
| Vauxhall Movano | 59.4% | 60.0% | 52,835 | 9.1 years | May include motorhomes built on this van |
| Nissan NV400 | 59.3% | 62.4% | 7,622 | 7.0 years | |
| Fiat Scudo | 59.3% | 53.0% | 7,241 | 14.2 years | |
| Nissan NV200 | 59.2% | 58.4% | 29,700 | 8.9 years | Includes passenger versions |
| Renault Trafic | 59.0% | 57.7% | 113,547 | 10.1 years | |
| Vauxhall Vivaro | 58.8% | 58.5% | 223,640 | 9.3 years | |
| Nissan NV250 | 58.4% | 68.2% | 2,163 | 3.6 years | Includes passenger versions |
| Mercedes-Benz Citan | 58.1% | 59.9% | 19,201 | 7.6 years | Includes passenger versions |
| Renault Kangoo | 57.8% | 53.7% | 50,035 | 12.1 years | Includes passenger versions |
| Nissan Primastar | 57.7% | 51.3% | 9,292 | 14.1 years | |
| Maxus Deliver 9 | 57.1% | 67.2% | 5,202 | 2.8 years |
Pickups
| Model | Adjusted for Age | Pass Rate | Tests | Average Age | Notes |
|---|---|---|---|---|---|
| Fiat Fullback | 75.8% | 80.0% | 2,700 | 7.0 years | |
| Volkswagen Amarok | 74.6% | 75.3% | 19,761 | 8.3 years | |
| Mercedes-Benz X-Class | 73.0% | 81.2% | 3,731 | 5.7 years | |
| Mitsubishi L200 | 70.4% | 68.3% | 77,235 | 10.7 years | |
| Toyota Hilux | 69.4% | 69.7% | 75,379 | 9.6 years | |
| Ford Ranger | 68.5% | 72.3% | 122,465 | 7.4 years | |
| Isuzu D-Max | 67.9% | 71.2% | 39,379 | 7.0 years | |
| Nissan Navara | 66.3% | 66.6% | 67,297 | 8.9 years | |
| Isuzu Rodeo | 65.1% | 54.1% | 4,055 | 16.4 years | |
| SsangYong Musso | 56.3% | 64.7% | 2,794 | 4.0 years |
Pass Rate by Fuel Type
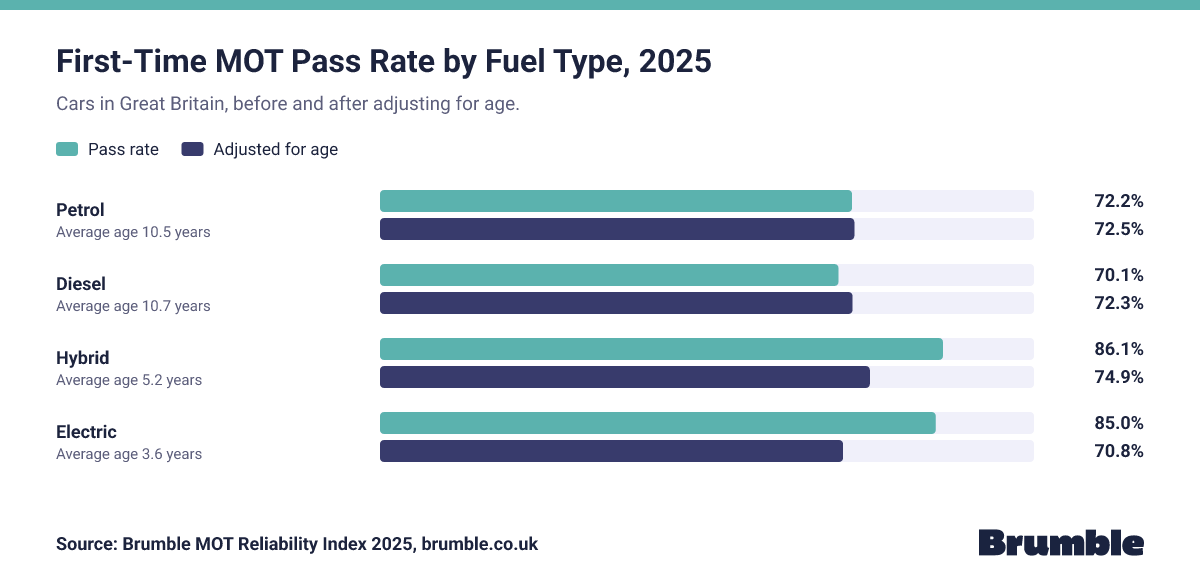
Hybrid and electric cars have high pass rates, but they are also much younger than petrol and diesel cars, so we adjust for age. After adjusting, electric cars came out a little below petrol cars (70.8% against 72.5%). At their first MOT, electric cars passed 87.3% of the time, against 90.4% for petrol cars.
- Pass rate
- Adjusted for age
Source: Brumble MOT Reliability Index, 2025 edition, from DVSA MOT data. brumble.co.uk/data
Embed This Chart
Copy this code to add the chart to your website. Please keep the source link.
<iframe src="https://brumble.co.uk/data/mot-reliability-index/2025/embed/fuel" title="First-Time MOT Pass Rate by Fuel Type, Brumble MOT Reliability Index 2025" width="100%" height="610" style="border:0;" loading="lazy"></iframe>
<p>Source: <a href="https://brumble.co.uk/data/mot-reliability-index">Brumble MOT Reliability Index</a></p>| Fuel | Pass Rate | Adjusted for Age | At First MOT | Average Age | Tests |
|---|---|---|---|---|---|
| Petrol | 72.2% | 72.5% | 90.4% | 10.5 years | 16,817,140 |
| Diesel | 70.1% | 72.3% | 88.5% | 10.7 years | 9,694,084 |
| Hybrid | 86.1% | 74.9% | 90.6% | 5.2 years | 1,669,320 |
| Electric | 85.0% | 70.8% | 87.3% | 3.6 years | 629,522 |
Pass Rate by Age of Car
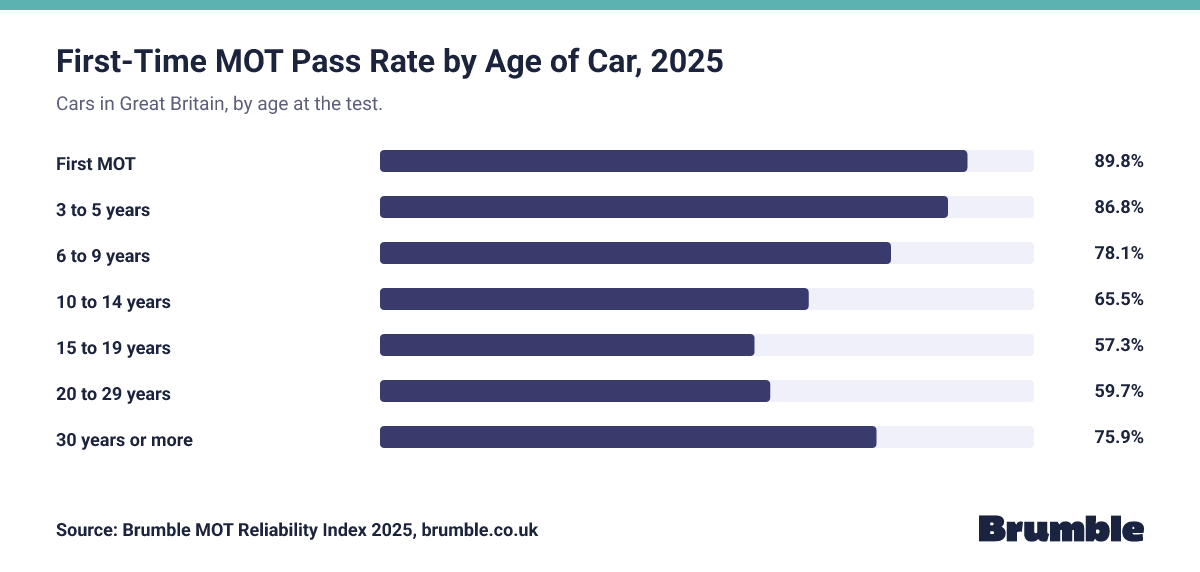
The older a car is, the more likely it is to fail, up to about 18 years old. After that the pass rate rises again, as the old cars still on the road tend to be well looked after. At their first MOT, 89.8% of cars passed.
Source: Brumble MOT Reliability Index, 2025 edition, from DVSA MOT data. brumble.co.uk/data
Embed This Chart
Copy this code to add the chart to your website. Please keep the source link.
<iframe src="https://brumble.co.uk/data/mot-reliability-index/2025/embed/age-bands" title="First-Time MOT Pass Rate by Age of Car, Brumble MOT Reliability Index 2025" width="100%" height="600" style="border:0;" loading="lazy"></iframe>
<p>Source: <a href="https://brumble.co.uk/data/mot-reliability-index">Brumble MOT Reliability Index</a></p>What Cars Fail On
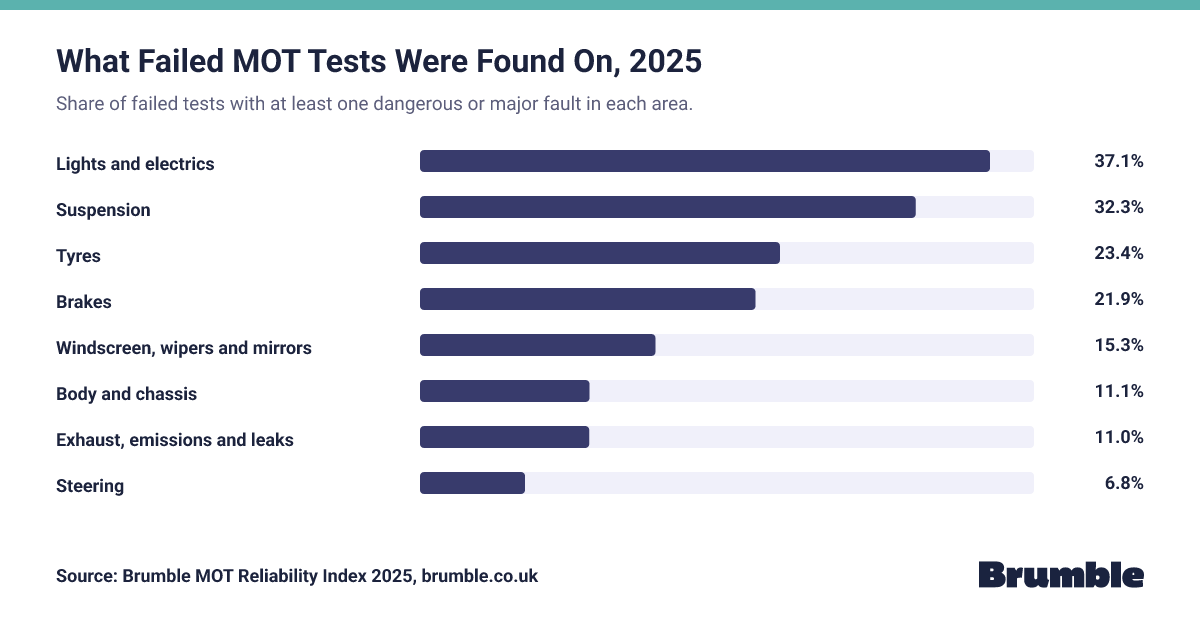
This shows the share of failed tests that had at least one dangerous or major fault in each area. It includes faults that were fixed at the test centre. One failed test can have faults in more than one area, so the shares add up to more than 100%.
Share of failed tests with at least one dangerous or major defect in each area. Source: Brumble MOT Reliability Index, 2025 edition, from DVSA MOT data. brumble.co.uk/data
Embed This Chart
Copy this code to add the chart to your website. Please keep the source link.
<iframe src="https://brumble.co.uk/data/mot-reliability-index/2025/embed/failure-categories" title="What Failed MOT Tests Were Found On, Brumble MOT Reliability Index 2025" width="100%" height="590" style="border:0;" loading="lazy"></iframe>
<p>Source: <a href="https://brumble.co.uk/data/mot-reliability-index">Brumble MOT Reliability Index</a></p>By Brand
- Ford
- All cars
Share of failed tests with at least one dangerous or major defect in each area. Source: Brumble MOT Reliability Index, 2025 edition, from DVSA MOT data. brumble.co.uk/data
Pass Rate by Postcode Area
This is the postcode area where the MOT test was done, not where the owner lives. You can search by postcode area, like CF, or by town, like Cardiff. Pass rates can differ between areas because of the roads, the weather and how cars are used, as well as how tests are carried out. The adjusted rate allows for the age of the cars tested in each area.
Showing the first 15 of 118 postcode areas. Loading the rest. The area is where the MOT test was done.
| Postcode Area | Adjusted for Age | Pass Rate | Tests |
|---|---|---|---|
| SM Sutton | 80.6% | 78.7% | 66,553 |
| UB Southall | 80.1% | 78.9% | 176,921 |
| SL Slough | 79.1% | 78.3% | 211,270 |
| RM Romford | 78.7% | 79.3% | 237,037 |
| HA Harrow | 78.7% | 78.2% | 176,338 |
| IG Ilford | 78.6% | 79.8% | 129,544 |
| EN Enfield | 78.0% | 78.4% | 172,665 |
| N North London | 77.9% | 76.6% | 197,717 |
| TW Twickenham | 77.9% | 78.4% | 219,543 |
| KT Kingston upon Thames | 77.8% | 78.6% | 253,075 |
| E East London | 77.7% | 77.2% | 226,831 |
| CR Croydon | 77.7% | 77.6% | 199,506 |
| SS Southend on Sea | 77.5% | 76.9% | 253,644 |
| B Birmingham | 77.0% | 76.2% | 921,671 |
| DA Dartford | 76.8% | 77.8% | 214,313 |
Brumble MOT Reliability Index Methodology
Which tests we count
- We use the MOT test results that the Driver and Vehicle Standards Agency (DVSA) publishes for Great Britain. This edition covers tests done from 1 January to 31 December 2025.
- For cars, we use class 4 tests. For vans and pickups, we also use class 7 tests, which cover larger vans.
- We count only the first normal MOT test of each vehicle in the year. Retests are left out, so each vehicle counts once.
- Pass rate = passes ÷ (passes + fails + passes after faults were fixed at the test centre). This is the same way DVSA works it out. A car that had a fault fixed during the test counts as a fail.
- For what cars fail on, we count dangerous and major faults, including ones fixed at the test centre. Minor faults and advisories are not counted.
How we adjust for age
We work out the pass rate for all cars at each age. For each brand, we then work out the pass rate we would expect, given how many of its cars are each age. The adjusted rate is the pass rate for all cars, multiplied by the brand's real pass rate, divided by its expected pass rate. This is called indirect standardisation.
A worked example
- Say cars aged 3 pass 90% of the time and cars aged 10 pass 60% of the time. All cars together pass 75% of the time.
- A brand has 300 cars aged 3 and 100 cars aged 10.
- We would expect it to pass (300 × 90% + 100 × 60%) ÷ 400 = 82.5% of the time.
- It really passed 87.5% of the time, which is better than expected.
- Its adjusted rate is 75% × 87.5 ÷ 82.5 = 79.5%.
- We measure age as full years from the date the car was first used to the date of the test. Cars can have their first MOT up to a month before they turn 3, so most first MOTs show as age 2. In 2025, cars aged 2 passed 89.7% and cars aged 3 passed 88.6%. Our "First MOT" group is ages 0 to 2.
- We use each single year of age up to 29. Cars aged 30 or more are grouped together.
- We do not adjust for mileage. We show how far each brand's cars had driven compared with other cars of the same age, so you can see where it might matter.
- The adjustment can be misread. A high adjusted rate does not mean a brand's cars will pass that often. It means they did better than cars of the same age usually do.
- For car models, we do not show an adjusted rate. Some models are mostly old cars that are driven very little, and for these the adjusted rate can go above 100%, which is not a real pass rate. Instead we show how many percentage points each model was above or below its expected rate. The download still has the expected and adjusted rates for every model.
Brands and models
- We join make names that are written in different ways: MERCEDES and MERCEDES BENZ count as Mercedes-Benz, RANGE ROVER counts as Land Rover, and SMART (MCC) counts as Smart. London Taxis International counts as LEVC.
- CHRYSLER-JEEP is split into Chrysler, Jeep, Dodge and Chevrolet by model. DODGE (USA) counts as Dodge and CHEVROLET GMC counts as Chevrolet.
- DS is shown on its own. Older DS3, DS4 and DS5 cars sold as Citroens stay with Citroen, as that is how they are recorded.
- MG is split in two. Cars first used in 2010 or earlier, and older MG models like the TF, are shown as MG Rover era. Cars first used from 2011, when the new MG range began, are shown as MG.
- Main table: brands with 20,000 or more tests. Specialist table: 2,000 to 19,999 tests. Models: 2,000 or more tests. Vans: 2,000 or more tests.
- When you filter by fuel or age, we show a figure when it is based on 2,000 or more tests.
What we leave out of the car tables
We started with 31,707,812 class 4 and 1,044,011 class 7 first MOT tests. The car tables use 28,828,560 of them. We left out:
- Vans: 3,350,672 tests (shown in the van table)
- Pickups: 414,814 tests (shown in the pickup table)
- Motorhomes and campervans: 107,612 tests
- Larger goods vehicles that are not on our van list: 36,878 tests
- Trucks, buses and other commercial makes: 7,697 tests
- Quad bikes, trikes and other vehicles that are not cars: 5,590 tests
Because of this, the pass rate for all cars (72.6%) is a little higher than the 71.9% for all class 4 vehicles on our MOT pages, which include vans and motorhomes.
Methodology version: 1.0.
For Journalists
Ryan Hughes, founder of Brumble, said: "Age makes a big difference to MOT results, so we adjusted for it to give a fairer picture of how each brand performs. Whatever you drive, simple checks like lights, tyres and wipers before your MOT can help you avoid an easy fail."
Notes to Editors
- The Brumble MOT Reliability Index 2025 shows how often car brands and models in Great Britain passed their MOT first time in 2025, once age is taken into account.
- We used the MOT results that the Driver and Vehicle Standards Agency (DVSA) publishes. We counted the first normal MOT test of each vehicle in 2025. For each brand, we worked out the pass rate we would expect for cars of the same ages and compared it with the real pass rate. Vans and pickups have their own tables, and motorhomes are left out.
- The figures cover 28,828,560 first MOT tests of cars, 3,350,672 of vans and 414,814 of pickups.
- These are MOT results only. They do not measure breakdowns, repair costs or how reliable a car is mechanically.
- Brumble's figures are free to use under the Creative Commons Attribution 4.0 licence (CC BY 4.0). The DVSA data is licensed under the Open Government Licence v3.0.
- How to cite: Source: Brumble MOT Reliability Index, 2025 edition, published 4 November 2026, brumble.co.uk/data/mot-reliability-index/2025
Press Contact
For comment, interviews or more detail on the data, email contact@brumble.co.uk or visit our press office.
Questions and Answers
Once age is taken into account, Porsche had the highest first-time pass rate of any brand with 100,000 or more tests, at 87.3%. Dacia had the lowest, at 63.3%.
72.6% of cars passed their first MOT test of the year in Great Britain. This is based on 28,828,560 tests.
87.3% of electric cars passed at their first MOT, compared with 90.4% of petrol cars. Electric cars are much younger on average, so their overall pass rate looks high until age is taken into account.
Lights and electrics came up most often: 37.1% of failed tests had at least one dangerous or major fault there. Suspension came next, at 32.3%.
Older cars fail more often, so we compare each brand with the pass rate we would expect for cars of the same ages. The adjusted rate shows how a brand might do if its cars had the same age mix as all cars.
No. These are MOT results only. They do not measure breakdowns, repair costs or how reliable a car is mechanically, and many MOT fails are for parts that wear out, like bulbs, tyres and wiper blades.
Download the Data
You can use these figures for free. Please credit Brumble and link to this page.
- Download the CSV (145.3 KB)
- Download the detail JSON (219.4 KB)
Cite This Index
Plain Text
Source: Brumble MOT Reliability Index, 2025 edition, published 4 November 2026, brumble.co.uk/data/mot-reliability-index/2025
Harvard
Brumble (2026) Brumble MOT Reliability Index: 2025 edition. Published 4 November 2026. Available at: https://brumble.co.uk/data/mot-reliability-index/2025 (Accessed: date)
HTML Link
<a href="https://brumble.co.uk/data/mot-reliability-index/2025">Brumble MOT Reliability Index</a>
Licence
Brumble's tables, charts and figures are licensed under the Creative Commons Attribution 4.0 licence (CC BY 4.0). You can use them, including for commercial use, as long as you credit Brumble.
The MOT data comes from DVSA. Contains public sector information licensed under the Open Government Licence v3.0.
Previous Editions
This is the first edition. We plan to publish a new edition each year, once DVSA releases a full year of MOT results.
Sources
- Anonymised MOT tests and results, Driver and Vehicle Standards Agency (DVSA). Contains public sector information licensed under the Open Government Licence v3.0.
The Brumble MOT Reliability Index ranks car brands and models in Great Britain by how often they pass their MOT first time, once the age of each car is taken into account. It is built from DVSA MOT test results.
Corrections
No corrections have been made to this edition.